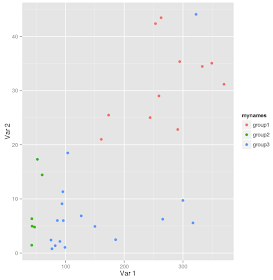
> library("ggplot2")
> group1_var1 <- c(349.0,332.9,244.1,294.4,253.2,262.8,161.0,369.8,259.1,291.1,173.4)
> group2_var1 <- c(42.5,60.4,43.2,42.7,52.2,47.3)
> group3_var1 <- c(126.9,99.1,75.4,299.8,77.0,317.0,265.5,185.4,94.1,90.5,103.8,82.6,150.1,322.3,95.5,86.2,96.3)
> group1_var2 <- c(35.06,34.46,25.02,35.36,42.37,43.46,21.00,31.17,29.02,22.82,25.48)
> group2_var2 <- c(1.45,14.44,4.97,6.35,17.31,4.81)
> group3_var2 <- c(6.88,1.05,2.41,9.72,0.80,5.58,6.26,2.48,9.11,2.15,18.49,1.37,4.92,44.08,11.34,6.01,6.00)
> var1 <- c(group1_var1, group2_var1, group3_var1)
> var2 <- c(group1_var2, group2_var2, group3_var2)
> mynames <- c(rep('group1',length(group1_var1)), rep('group2',length(group2_var1)), rep('group3',length(group3_var1)) )
> mydata <- data.frame(var1,mynames,var2)> myplot <- ggplot(mydata, aes(x=var1, y=var2, color=mynames)) + geom_point(shape=19)
> myplot + ylab("Var 2") + xlab("Var 1")

Another example:
(where I have two variables, 'logcontiguity' and 'genecount'):
> mydata <- data.frame(genecount=genecount,logcontiguity=logcontiguity)
> ggplot(mydata, aes(x=logcontiguity,y=genecount)) + geom_point(shape=19,col="blue") + ylab("Gene count") + xlab("Log(assembly contiguity)")
To add a vertical line :
> ggplot(mydata, aes(x=logcontiguity,y=genecount)) + geom_point(shape=19,col="blue") + ylab("Gene count") + xlab("Log(assembly contiguity)") + geom_vline(xintercept=-0.3)
To specify the colours yourself:
Specify 'color=' in ggplot command.
Then use 'scale_color_manual' to set the colours.
Something like this:
> myplot3 <- ggplot(mydata_c, aes(x=myvalues_b, y=repeatMb, color=myxorder)) + geom_point(shape=19) # shape=19 is filled circle
> myplot3 <- myplot3 + ylab("Repeat (Mb)") + xlab("Genome Size (Mb)") + ggtitle("C. Repeat Content vs Genome Size") + scale_color_manual(name="Clade",values=c("#66AD1F","#3476D8","#29CCB1","#9D55CD","#EE2A0F","#CCAC00","#760000")) + theme(axis.text.x=element_text(size=8))
Remove the legend for the colours:
Something like:
... + theme(legend.position="none")
No comments:
Post a Comment